Discover local insights
UX+UI
Overview
Discover local insights is a web app that empowers customers in exploring commercial behavioral trends around the neighborhood. I’m the UX and UI designer in the team, along with a developer.
My role
UX, UI
Our process
This is our process with campaign manager, product manager, design team and development team.
Part of the process are confidential.
Requirement
My task is to design a business-oriented app combined with Tapestry Segmentation. Rather than dropping people into a map with a query field for a ZIP Code, the app should step users through an intuitive wizard that results in a map.
At the kick off meeting, I summarize the following requirements:
– Map Based
– Business-oriented
– Tapestry Segment
– Zip code
– Add in a sample of interesting data variables
– Share results
Goal
As a result, users will get higher response rates, avoid less profitable areas, and invest their resources more wisely.
Showcase how Esri’s vast business and demographic data can provide even greater insight when combined with data that businesses already hold.
Users will reach out the product team for more information.
Existing Resources
ArcGIS Tapestry Segmentation is a solution to understand customers’ lifestyle choices, what they buy, and how they spend their free time. It gives users insights to help them identify their best customers, optimal sites, and underserved markets.
There are 67 Tapestry Segmentation to describe American’s neighborhood life mode. It includes demographic data, consumer spending data, and lifestyle/behavioral trends.
Research
Card sort by business owners and marketing managers shows the priorities of the business data sets. This acts as the blueprint of the app structure.

After I get the priority of the business data categories, I pick the top data sets from each catergories.

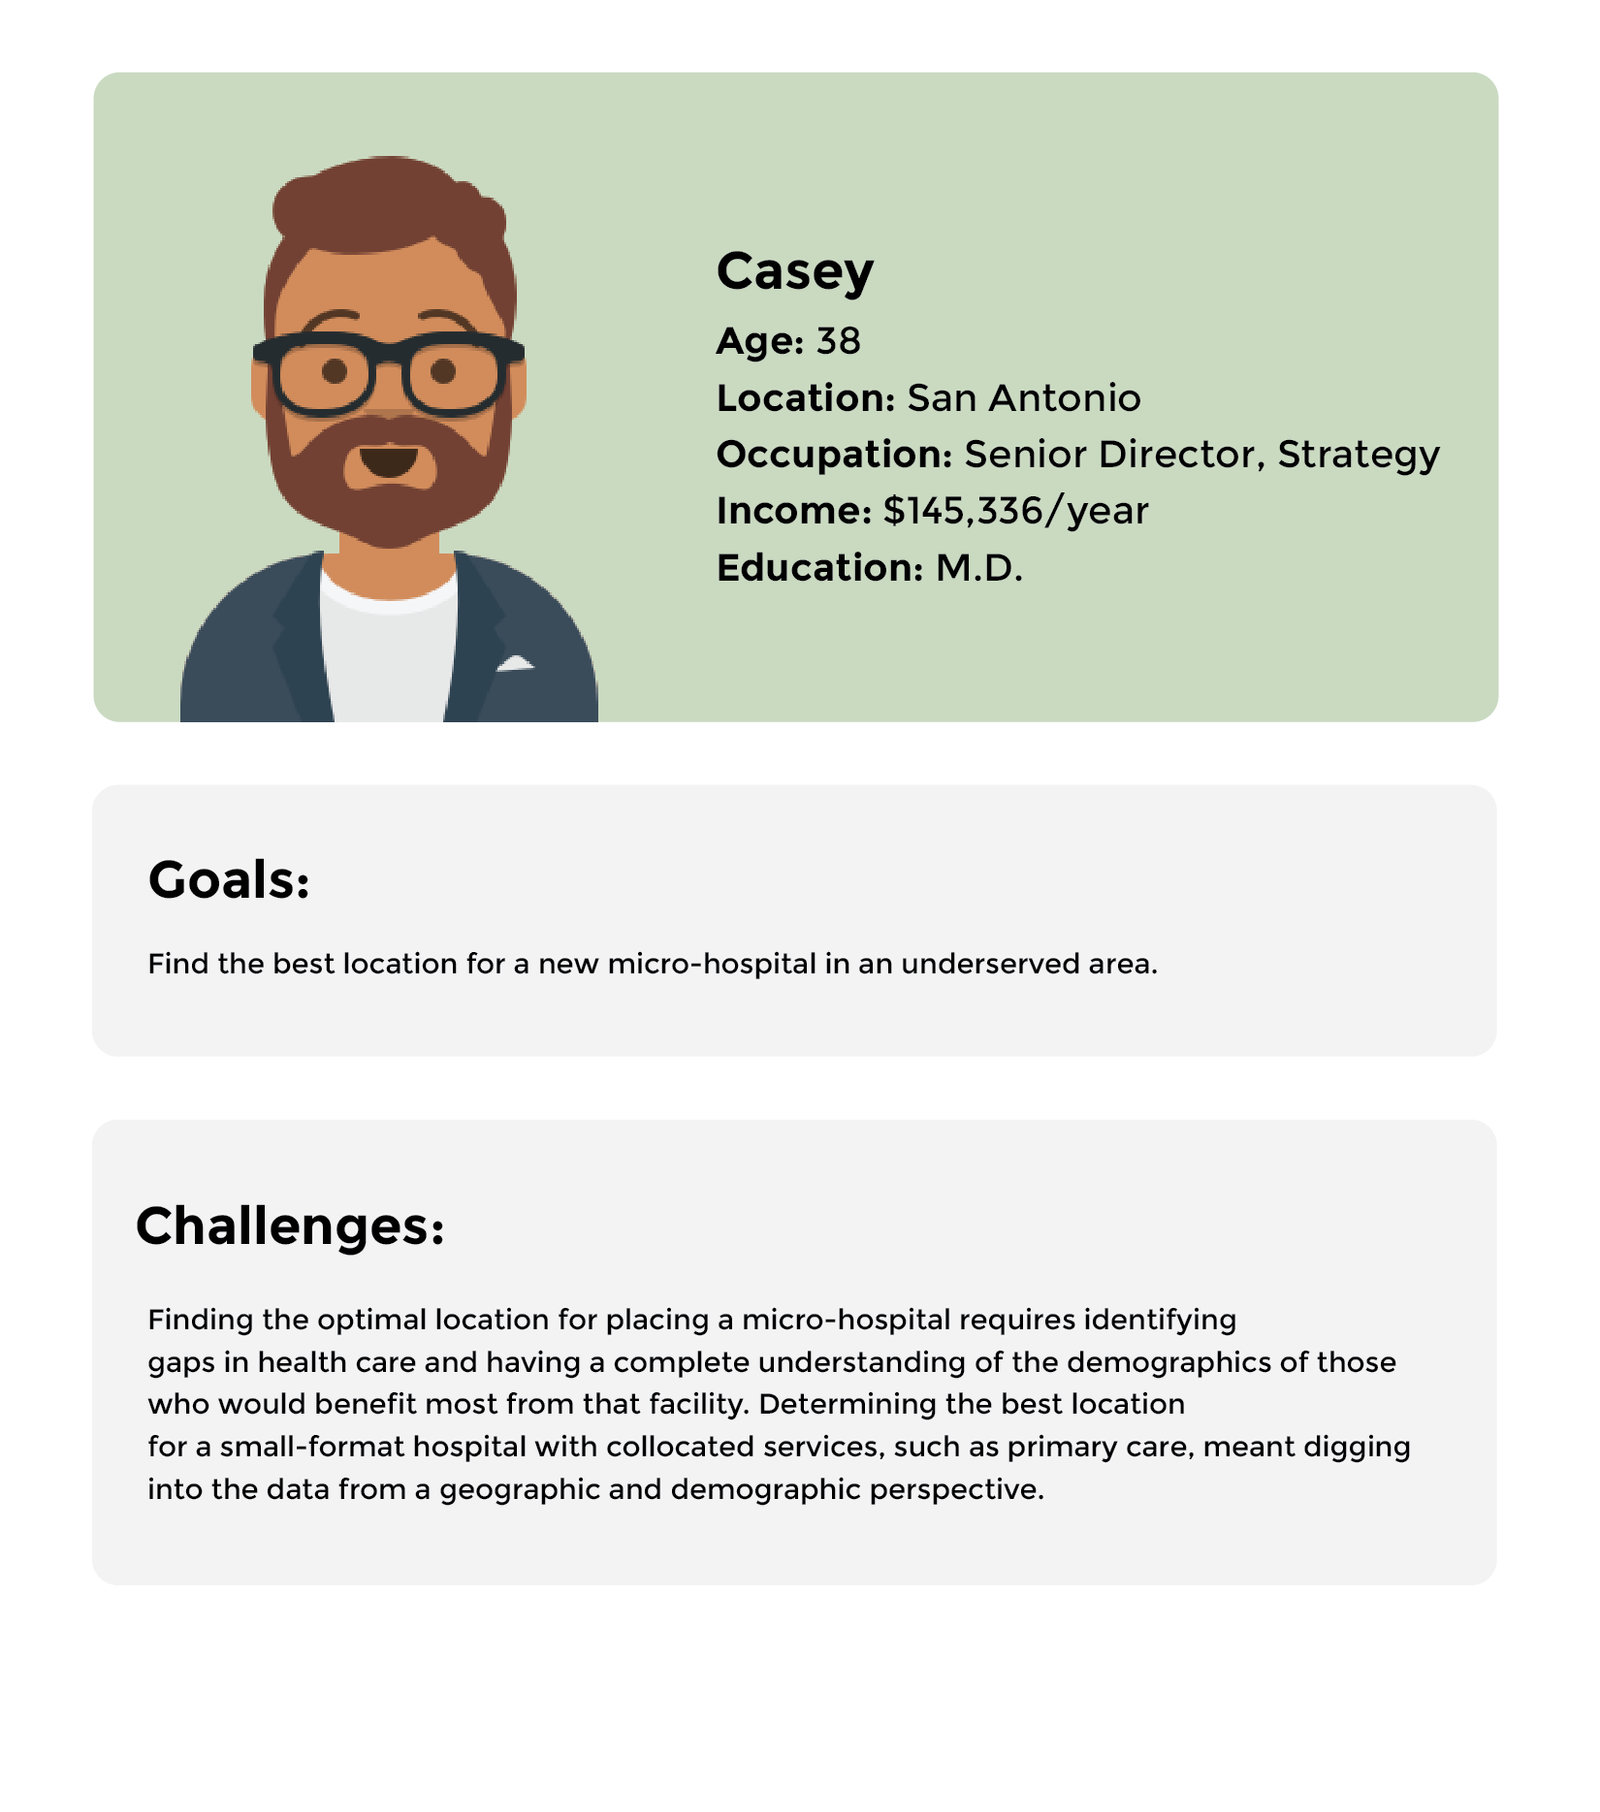
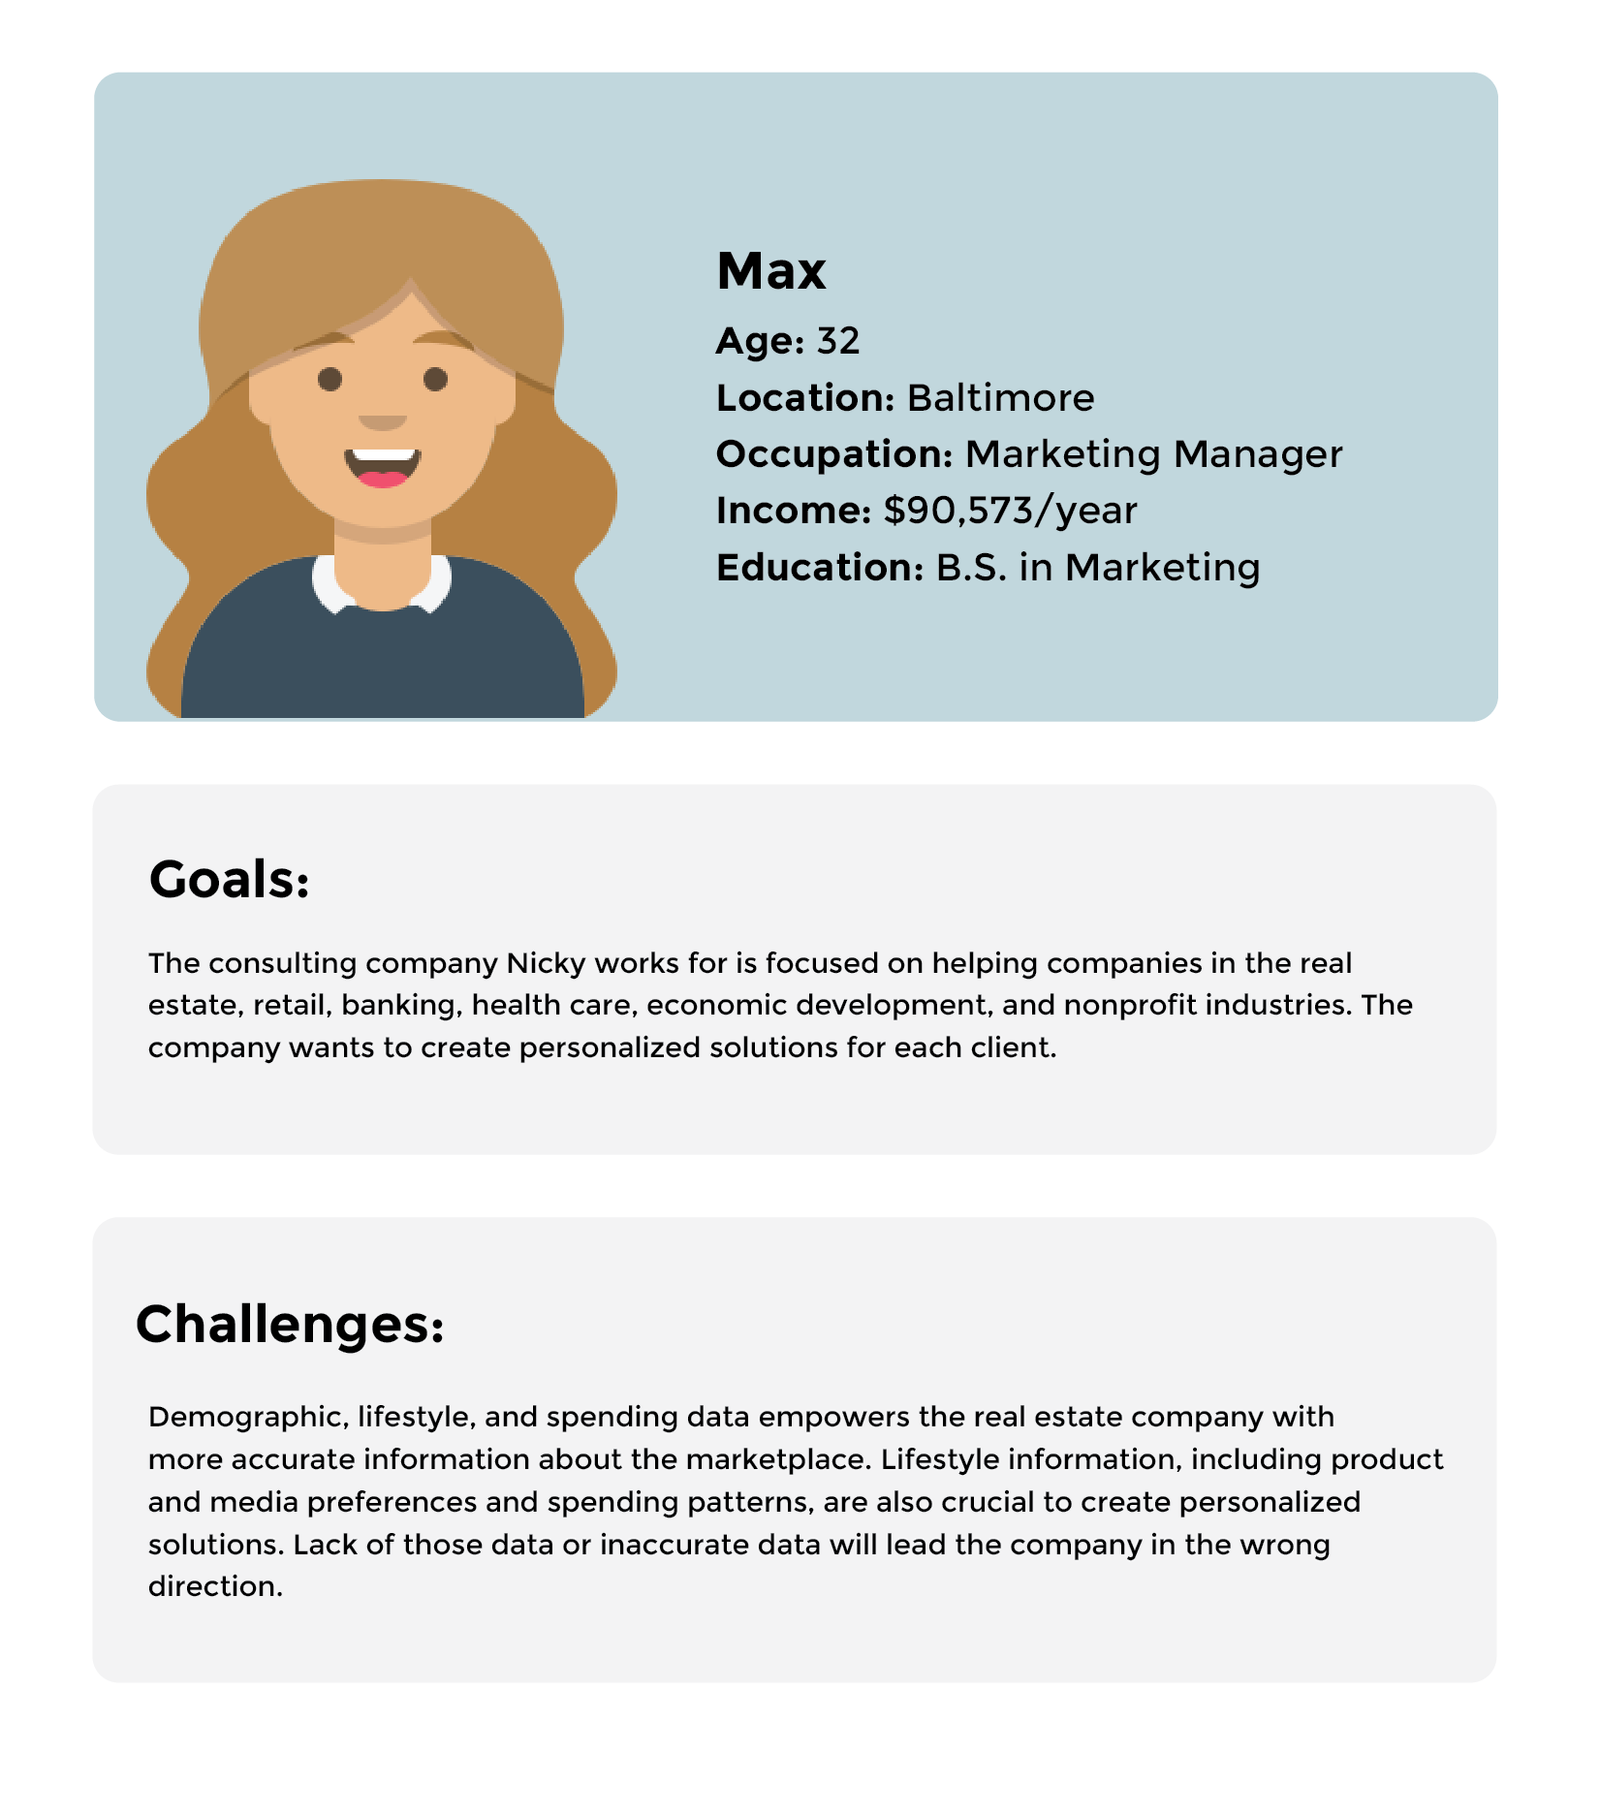
Persona


Designs
Splash screen & enter zip
Splash screen briefly explains what users are about to experience. Then enter zip code and choose two data categories to initiate the app.


Main screen
The central part of the app is based on maps. The map is divided into colorful zip code area, each color represents the top Tapestry Segments of this zip code area. Hover the zip code area will show users the Tapestry name. By clicking the area, users will get 4 sets of visualized data. The top three Tapestry Segments and Median Income are default data. The other two are the ones user choose in the previous step. Each data will expand and show details on click. There are also two analysis tools: Drive Time and Ring Buffer function at the top right corner to help users find out how geoinformation will affect this area.
After 3 tryouts, the app will gate the user and ask for contact info.

Elevation


